
If you’ve ever stared at a folder full of PDFs, meeting transcripts, and messy notes wishing you could just snap your fingers and turn them into a spreadsheet, your wish has been granted.
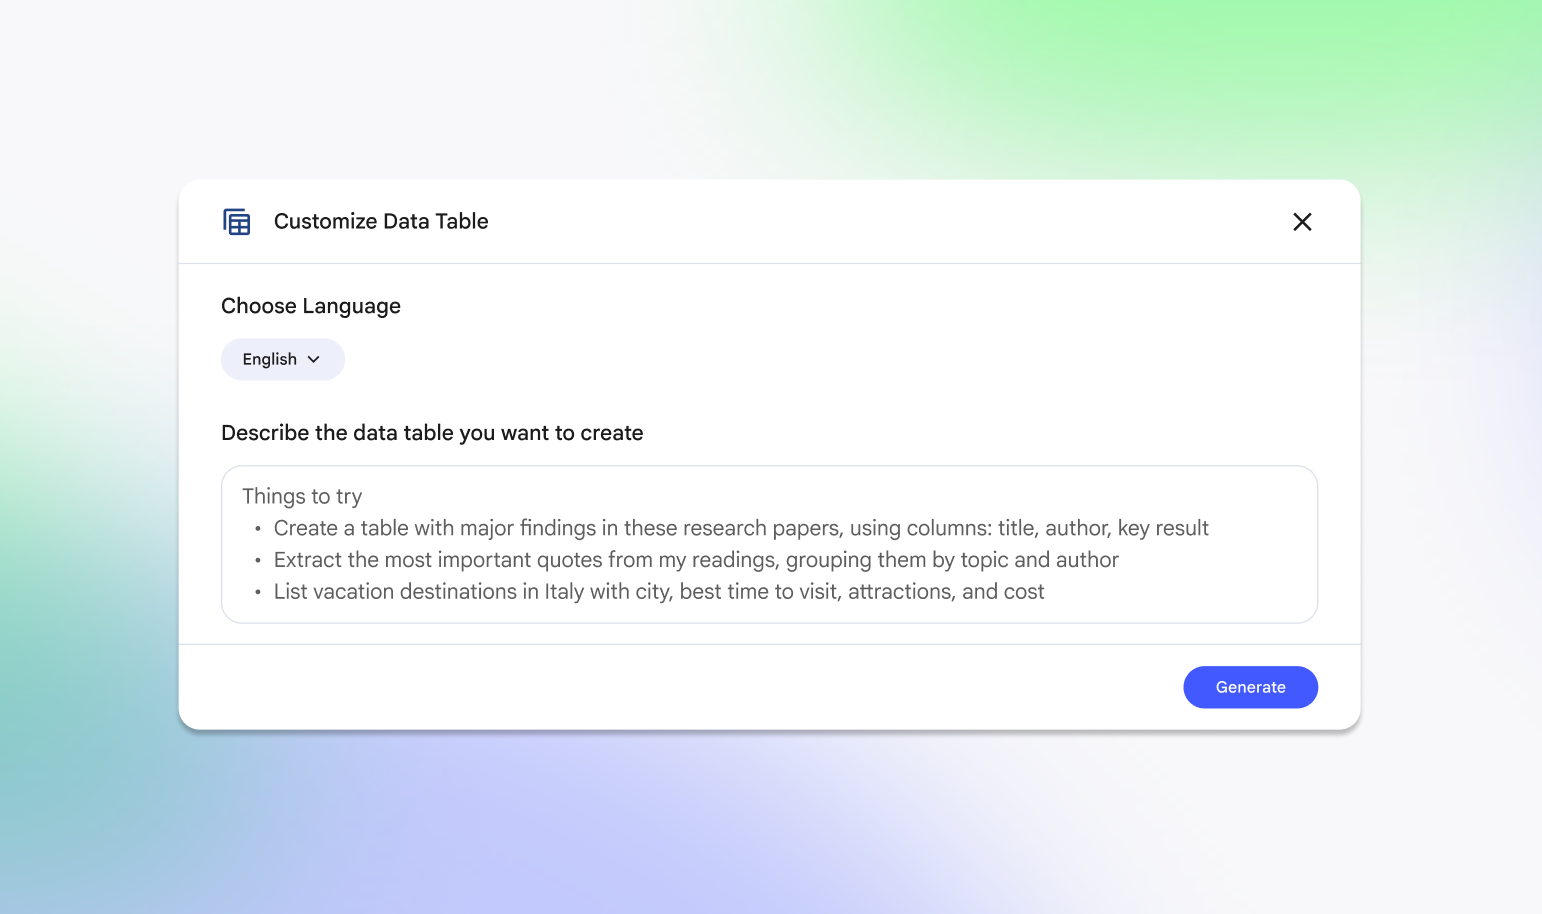
Google has introduced Data Tables in NotebookLM, a powerful new feature that instantly transforms your unstructured sources into clean, organized rows and columns. It’s not just a summary; it’s a structured analysis tool that helps you spot patterns, compare data, and make decisions faster.
Here is everything you need to know to get started.
NotebookLM has always been great at answering questions based on your documents. Now, it can visualize that information. Data Tables allow you to instruct NotebookLM to extract specific variables from your uploaded sources and organize them into a tabular format. Once generated, you can export these tables directly to Google Sheets for further analysis.
1. The Project Manager: Instant Action Item Logs
Stop manually re-typing action items from meeting recordings. Upload your meeting transcripts to NotebookLM and ask it to:
"Create a table of all action items, listing the 'Task Description', 'Assigned Owner', 'Due Date', and 'Priority Level'."
2. The Marketer: Competitor Analysis Matrix
Upload the "Pricing" and "Features" pages from your top 5 competitors as PDFs or links. Ask NotebookLM to:
"Build a comparison table analyzing 'Price per User', 'AI Features Included', and 'Customer Support Level' across all sources."
3. The Hiring Manager: Candidate Scorecards
Upload a batch of resumes and the job description. Ask NotebookLM to create a decision matrix:
"Create a table for these candidates listing 'Years of Experience', 'Key Skills Matched', 'Education', and a 'Relevance Score' based on the job description provided."
This feature shifts NotebookLM from a study buddy to a serious business intelligence tool. By automating the tedious work of data extraction, you can spend less time copy-pasting and more time analyzing the strategic implications of your data.
Need help with these new tools? Contact Cloudasta today, our experts are here to help!


